The goal of this lab was to use the ArcGIS Web AppBuilder, as we did in Lab 3, to create an app which has operational layers, is time aware aand has feature access services. The JavaScript API is an interface which allows programmer to build themes, widgets and other analytics from scratch based on components of existing apps. ArcGIS API for JavaScript is a simple way o embed maps and tasks into various web GIS applications and in this lab we will learn use the skills we have previously learned such as HTML, CSS and JavaScipt coding.
Methods
Part 1: Creating a Basic Web GIS Mapping App
In the first part of this lab exercise we completed the following list of tasks:
- Set up a basic HTML document
- Set up a basic JavaScript document
- Reference the ArcGIS API for JavaScript in your HTML document
- Use a basemap from ArcGIS Online
- Specify the map zoom level and center point
- Display the map full screen
We first set up a basic HTML document and then referencing an external CSS style sheet as well as the style sheet for web maps created by Esri. We linked the CSS style sheet by using the link tag which connects our individual application to the Dojo Dijit theme, particularly in this case the claro theme. The Esri style sheets are used to style features on a web map and since most of the styling for this map was done externally using the claro style sheet we wrote a CSS file to include it (Fig. 1).
 |
| (Fig. 1) To create the HTML document for this portion of the lab we linked various external style sheets. |
 |
| (Fig. 2) The body class was defined as claro and referenced the JavaScript file to be used in this part of the lab. |
 |
| (Fig. 3) This shows the JavaScript used in part 1 of this lab. |
Part 2: Build a Web GIS App with Operational Layer Functionality
In this part of the lab we first developed a JavaScript method to display tree species and attributes for the City of San Francisco. To do this we started by creating a new HTML 5 document and referenced two different external stylesheets.
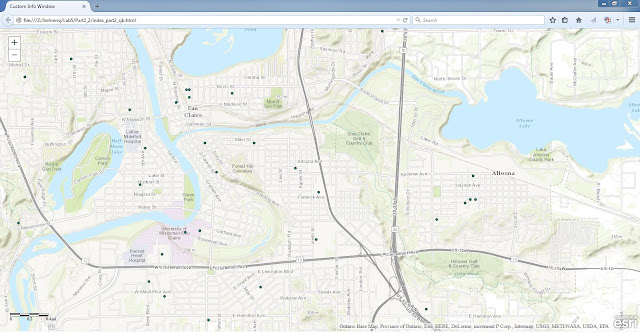
After getting the HTML document set up we then started the JavaScript text. We entered the require command to access the modules for dojo DOMs, dojo string, myModules and Esri. Once this was done we created a function with the parameter definitions for the various components of the app as listed in the previous sentence (Fig. 4). Next, we created an infoWindow variable with arguments in order to create a new infoWindow. Then we declared a map variable that was assigned the value of a new map object with coordinates specific to Eau Claire. Once this was done we declared the new template variable which was used to display the popup content when an end-user clicks a feature on the application. The final variable we declared was the featureLayer which referenced a feature service of the study area (Fig. 5). After we linked the Eau Claire schools feature class to the JavaScript document we were able to view the output (Fig. 6).
 |
| (Fig. 4) This shows the list of modules accessed for this lab. |
 |
| (Fig. 5) This is the JavaScript used for part 2 of the lab. |
In developing a simple routing application we wanted to accomplish three main objectives. First, we wanted the user to be able to click on the map and add stops to a route, we also wanted a route to be calculated after at least two stops were added and finally we wanted the route to be extended when subsequent stops were added to the map.
After setting up the basic <html>, <head> and <meta> tags we added the viewport tag in order to make the application responsive in ISO devices (Fig. 5). Next we referenced two external style sheets which we have used in the past, the esri and claro style sheets.
 |
| (Fig. 7) The start of the HTML code for part 3 of the lab. |
We then needed to write a function with multiple definition parameters to close the require command and leverage the Dojo modules we did in the previous step. These variables included the stop symbol, lastStop, routeSymbol etc.
Next we created a new map object in the JavaScript code in which we used the "streets" basemap via Esri and we centered the map to the Eau Claire area by entering in the latitude and longitude for Eau Claire. Then we created an event which would cause a stop to be added when the end-user clicks on a particular portion of the map. We then referenced the network service from the Esri sample server 3. To further set up the route parameters we used the following code seen in Fig. 8. In addition to this we wrote an argument to solve the route task and show the results on the map within the application.
 |
| (Fig. 8) |
 |
| (Fig. 9) |
Results
 |
| (Fig. 4) This is the output image of the first part of the lab. |
 |
| (Fig. 6) This is the output of part two of this lab. |
 |
| (Fig. 10) The final routing application created in this lab in part 3 can be seen here. |
Sources for this lab are listed below:
- EC_Schools feature class was obtained from MapCruzin.com at:
- http://www.mapcruzin.com/geographic-names-shapefiles/#School
- EC_Schools_Address was assembled by GEOG 455 class, fall 2013Widget_infowindow files were provided by Esri at :
- https://developers.arcgis.com/javascript/jssamples.html
No comments:
Post a Comment