Volunteered geographic information, or VGI, is a form of geographic data collection which allows the general public to both collect and upload GIS data. The main goal of this lab was to learn how to develop a web GIS VGI application which can be used by the general public to report GIS data. First, we were given a hands-on experience of how to create the necessary domains and subtypes for enterprise geodatabase features. Next we prepared a feature template specifically for the type of data we wanted the end-user to collect. Then we created editing services to allow the data to actually be collected and developed a user friendly interface for the app, verifying the integrity of the data which is added by the public via the application.
Methods
Part 1: Authoring a Map Document to Support Feature Services and Web Editing
In the first part of this lab, we authored a map document in order to enable end-users to add points, lines and polygons to a VGI Web GIS application. For example, we will allow for users to add different types of features including fire hydrants, sidewalks and green spaces as well as assign them attribute data.
We were given the follow scenario to develop our VGI application:
"The City of Eau Claire has contracted your geospatial company to efficiently collect information about the status of public infrastructure in the city within a two week period. The city only has limited amount of money to pay you for this project. You have examined the money your company will make from this project and realized that the most economically feasible way of executing this project is to crowd source the task to the general public as you won’t afford to hire field workers or send your staff members to the field. A VGI app is absolutely essential for a successful completion of this job. You will use and accentuate your web GIS app development skills in this project."
To start we needed to create attribute domains and subtypes for the three main features we will be incorporating in to this VGI application: fire hydrants, sidewalks and green spaces. Domains are simply rules which are placed on the values that are accepted within fields of a feature class. To do this we used ArcMap and created a new geodatabase. In this new geodatabase we defined the domain properties for our three feature classes (Fig. 1). It's important to define the domains in order to limit the amount erroneous information entered by end-users collecting information using this app.
 |
(Fig. 1) This displays the database properties defined when creating our VGI application feature classes.
|
After these properties were added and the feature classes were created we wanted to allow the end-user to upload attachments to the data they collect. To do this we needed to create attachments for each of the three feature classes.
Since creating a simple and easy user interface is of great importance when developing a VGI for the general public as we are we needed to change the symbols of our features. We did this to make it clear what type of data the end-user is collecting (Fig. 2).
 |
| (Fig. 2) To increase the usability of this VGI application we changed the colors of the symbols in order to make it more clear to the user what type of features they are creating when adding data using the application. |
Part 2: Prepare your Enterprise Geodatabase Feature Template for Publishing
After creating the feature classes we need to prepare the document to be published via ArcGIS server. To do this we connected to the ArcGIS server on our campus and shared the files as services and then published them to our personal folder within the Geography department enterprise geodatabase. Just before publishing the features however we need to edit the service to enable feature access capabilities. This will allow users to edit, delete and add data in each of the feature classes. Once this is done the services can be published and will be incorporated into the coding in part 3 where we produced the application itself.
Part 3: Consuming the Feature Service in a Web GIS Application
The first step in creating a VGI Web GIS application was designing the webpage which will host it. We started by creating an HTML 5 document including relevant meta tags like the ones which will make the application compatible on both iOS and Android mobile devices. We also referenced the dijit claro and Esri stylesheets (Fig. 3).
The next code document we created was the JavaScript in order to program the behavior and function of the VGI app. We started the JavaScript document by declaring the "map" variable and importing several modules and dijits from the Dojo library as well as modules from Esri. After the map variable was declared and we imported the necessary modules we declared a function to define several definition parameters (Fig. 5).
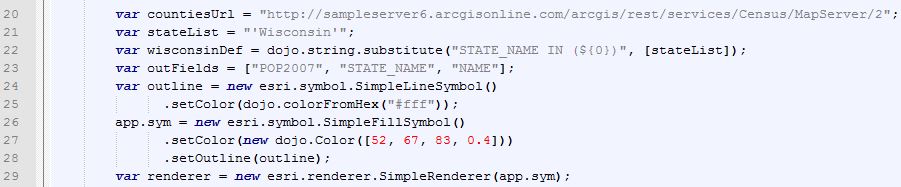
Then we called the parse() function in order to execute the dojo dijits as well as enabled the snapping, identify proxy and reference the Esri geometry service. After this we created a new map object and set the values of the map to make sure that the map is centered on the UW-Eau Claire campus (Fig. 6).
Next, we incorporated the feature classes we created in parts 1-3 to our VGI app. To do this we needed to assign the editing module imported from the Dojo library to each of the feature objects individually. To do this we created three variables, one for each the point, line and polygon feature access service we published previously. As seen in Fig. 7 we referenced the feature services.
Once this is done we called the method which adds these features to the map, resizes the infowindow and creates an event function. The event function works to "listen" for interactions between the end-user and the VGI application (Fig. 8). After this we added some additional map and parameter settings as well as parameters used in the editor widget and the snapping function of the map (Fig. 9). That was the end our our JavaScript document. The final step was connecting our CSS and JavaScript documents to the original HTML code we started. The output of this map can be seen in Fig. 10 under the results section of this report.
Part 4: Developing an Independent VGI Application to Collect Additional Data
In the final part of the lab, we were tasked with the job of using the skills we learned in parts 1-3 to create our own VGI application. The final product can be seen in Fig. 11 the results section.
Results
Sources
Data for this lab was collected from the following sources:
After creating the feature classes we need to prepare the document to be published via ArcGIS server. To do this we connected to the ArcGIS server on our campus and shared the files as services and then published them to our personal folder within the Geography department enterprise geodatabase. Just before publishing the features however we need to edit the service to enable feature access capabilities. This will allow users to edit, delete and add data in each of the feature classes. Once this is done the services can be published and will be incorporated into the coding in part 3 where we produced the application itself.
Part 3: Consuming the Feature Service in a Web GIS Application
The first step in creating a VGI Web GIS application was designing the webpage which will host it. We started by creating an HTML 5 document including relevant meta tags like the ones which will make the application compatible on both iOS and Android mobile devices. We also referenced the dijit claro and Esri stylesheets (Fig. 3).
 |
| (Fig. 3) The start of the HTML code for our VGI application includes meta tags to make our app compatible on a variety of mobile devices and also references stylesheets we will use.
Next, we started to write the internal stylesheet which we used as a part of the VGI app user interface. We incorporated properties for the user interface body, template picker and panel header (Fig. 4).
|
 |
| (Fig. 4) This is the internal CSS document created in this lab to enhance the design of the VGI web GIS application we are creating in this lab. |
The next code document we created was the JavaScript in order to program the behavior and function of the VGI app. We started the JavaScript document by declaring the "map" variable and importing several modules and dijits from the Dojo library as well as modules from Esri. After the map variable was declared and we imported the necessary modules we declared a function to define several definition parameters (Fig. 5).
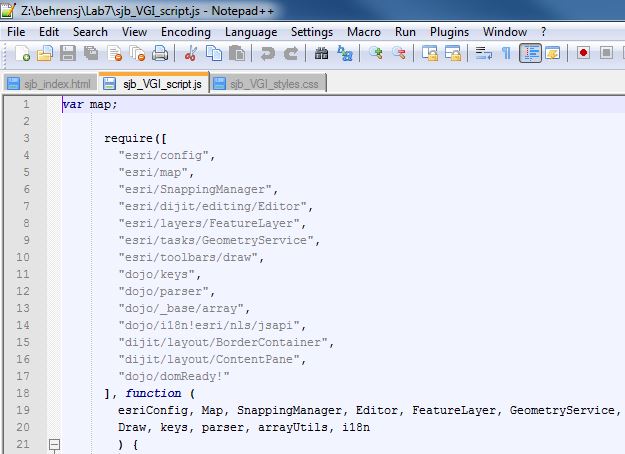 |
| (Fig. 5) At the start of the JavaScript code for our VGI application we imported various modules as well as dijits from the Dojo library and Esri and also declared a function to define the parameters of these modules. |
 |
| (Fig. 6) This block of code shows the enabling of the Esri geometry service and other features. |
 |
| (Fig. 7) These lines of code show how the feature classes we created in part 1 and published in part 2 were linked to the VGI application. |
 |
| (Fig. 9) This code enables the app to incorporate the feature services in Fig. 8. |
 |
| (Fig. 10) This image shows additional code used to add extra settings to the VGI application. |
In the final part of the lab, we were tasked with the job of using the skills we learned in parts 1-3 to create our own VGI application. The final product can be seen in Fig. 11 the results section.
Results
 |
| (Fig. 10) This is the output of the VGI application we created for the City of Eau Claire in parts 1-3. |
 |
| (Fig. 11) This image shows the VGI application I created in part 4 of this lab report. |
Sources
Data for this lab was collected from the following sources:
- Geometry service from Esri
- Red fire hydrant picture from www.dreamstime.com