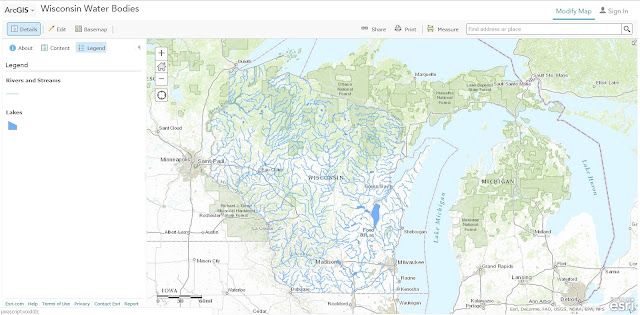
In this lab we were able to learn the skills to both author and create geospatial web services. Throughout this lab exercise we were introduced to the process of authoring geospatial data to create as well as host geospatial web services on ArcGIS Online for Organizations and also through the ArcGIS server and the server hosted by UWEC's department of Geography and Anthropology. During this lab we learned the techniques of how to publish geospatial web services to various formats such as ArcMap, through the ArcGIS server, shapefiles and Excel CSV files. We were introduced to the creation of a feature access service which allows for end-user editing.
Methods
Part 1: Publishing Feature Hosted Services through ArcGIS Online
In this first portion of the lab we needed zip a large feature dataset in order to upload the data directly to the ESRI cloud. To do this we first zipped the data and after logging in to ArcGIS Online added the file to our individual contents and publish the file as a feature service. Once the zip file was uploaded to ArcGIS Online and the file was published as a feature service it could then be added to a map. The layers within this zip file then became editable features within the web-based map.
 |
| (Fig. 1) This is the window which appears after the data from the zip file we created was published on ArcGIS. As can be seen in this image the data is now in the form of a feature service. |
Yet another way which we learned how to publish feature services was directly through ArcMap. By using this method, every dataset within the map document is published in a single instance. To do this we first loaded two data sets, lakes as well as rivers and streams, and selected to share as a service. The next step was to edit the feature service in order to control what types of edits the users can make. Feature services can be configured so that end users can create or add, delete query and update features or data within the feature service. Next, we had the option to share the service and within the service editor we clicked the "analyze" option in order for the program to examine the map you are about to publish and make sure there are no errors. As long as no errors are found (or the errors are fixed) the service can be published and viewed on ArcGIS Online.
Part 2: Publishing a Tiled Map Service Using ArcGIS Online
Similarly to part 1, the second part of this lab exercised focused on publishing feature services and other data types to ArcGIS Online, however in this portion we published these services using the ArcGIS Server. The first step in this process was to add a database connection using ArcCatalog. To do this we selected the SQL Server as our database platform and authenticated the database using our individual username and password. Next we added a raster data file to the new database we connected to. After cleaning up the dataset by changing the symbology a bit, we were ready to share the data as a service (similar to how we did in part 1 of the lab). However, one big difference in the procedure was connecting to the UWEC Geography and Anthropology Department ArcGIS Server in this portion. To do this we needed to add an ArcGIS Server by again entering in information such as the server URL and more authentication information (Fig. 3).
 |
| (Fig. 3) In order to share a service to ArcGIS Online using the ArcGIS Server we needed to connect to the server itself before our feature service was able to be published. |
Part 3: Author a Map Document, Create a Feature Service & Add to a Web Map
In the final part of the lab we authored a map, created a feature service and a reference for the service in a web map. The first step in this process was to import two sets of data: earthquakes and hurricanes. Next, we changed the symbology of both layers in order to make it easier for the viewer to understand which events were more severe than others by using a graduated color ramp for hurricanes and graduated symbols for earthquakes. Then we enabled time as a layer for both of the two sets of data. To do this we selected the "time" tab within the layer properties and used the dates of the events in the time field. Once this was applied in ArcMap we were able to enable the time on the map and view the progression of the events based on the dates each natural disaster occurred. When we later went to share the service and publish the features to ArcGIS Online we needed to enable this content in the "capabilities" portion of the service editor so that the end-users would be able to see this time progression in the final product as well.
 |
| (Fig. 6) Once both layers have time enabled we are able to use the time slider tool in ArcMap to display the events and make sure everything is working correctly. |
Results
As a result of this lab exercise we learned how to publish and share feature services from a wide variety of platforms including CSV files, zipped files, as well as directly using ArcMap and ArcGIS Server. The maps which I published can be seen using the links below.
Part 1 Maps:
Part 3 Map:
Sources
Data sources for this lab are listed below in the order they were used:
- Mastering ArcGIS Geodatabase by Maribeth Price, 2014
- Wisconsin DNR, 2013
- Cyril Wilson, 2012 (unpublished Lakes dataset)
- Advanced Remote Sensing Class at UW-Eau Claire, Fall 2012
- Fu, Pinde, 2015
- \\EsriPress\GTKWebGIS\Chapter3\Data.gdb\Earthquakes, courtesy of USGS National Atlas
- \\EsriPress\GTKWebGIS\Chapter3\Data.gdb\Hurricanes, courtesy of NOAA National Climatic Data Center


No comments:
Post a Comment