Thursday, September 24, 2015

Lab 3: Web AppBuilder for ArcGIS

Goals

The goal of this lab was to introduce us to the process of building Web GIS applications with the Web AppBuilder for ArcGIS. In learning how to do this we were able to create our own applications, as well as author and add our own services like those we created in Lab 2: Geospatial Web Services. We also learned how to configure and integrate custom widgets the apps we created and were able to deploy the finished Web GIS application so it can be used by an end-user. The second goal of this lab was to give us some experience in conceptualizing about the coding which goes into the process of creating a Web GIS app, which is something we will be creating later using coding in future labs. 


Methods


Part 1: Building Web GIS Apps through Web AppBuilder Integrated Edition


In part one of this lab exercise we were given the following scenario: 


"You have been employed by Virtual Geospatial Analytics and you are tasked with creating a web

GIS application that displays historic earthquakes and hurricanes to the public. Your supervisor
want the web GIS app to be able to perform the following:
  • Provide pop-up windows to show earthquakes and hurricanes.
  • Zoom to the entire United States in its initial view.
  • Provide bookmarks so that users can easily zoom to predefined areas.
  • Allow users to chart and compare the selected attributes of selected earthquakes.
  • Allow users to query for features based on their attributes.
  • Display appropriate logo, title, subtitle, and links in the banner.
  • Allow users to update recent earthquake information through batch editing."
The first step in this process was to create an app using the Web AppBuilder which is apart of ArcGIS Online. Once the Web AppBuilder was launched we were able to select one of our previous maps, in this case it was specifically the Natural Disasters map we created in lab 2. After our map was added to the app builder we then selected a theme. There are a variety of themes offered via ArcGIS Online including the billboard, box, dart, foldable, jewelry box, launchpad and tab but in this lab we used the foldable theme. 


(Fig. 1) The interface and setup to create the a web app using ArcGIS Online.
In addition to selecting a theme and color scheme we also added widgets to our web application. We first added the basemap gallery widget which allows the end user to view the map with a variety of different basemaps which they are able to chose themselves. Next we added the measurement widget which gives the end user the ability to take accurate measurements based on the map data. The bookmark widget is interesting because it allowed us to pan and zoom into a particular area of the map and create a bookmark of an area, in this case the western states. This bookmark is then available to the end user and will zoom them into the particular region we selected. 

Next we changed the attribute information for our web map and changed the title to "Historic Earthquakes and Hurricanes" and linked them to the UWEC Geography and Anthropology website.

We then added the chart, draw and query widgets. We were able to configure the chart widget by selecting the earthquake layer and choosing the location category and under the value fields selecting the magnitude data and creating a bar chart type. Next we created another chart which showed the earthquake locations as well as depth (km)  in the form of a column chart. 


(Fig. 2) A chart is a widget which can be created using the ArcGIS Online Web AppBuilder to display a more organized view of the earthquake data.
The query widget also needed to be configured. To do this we first needed to make sure that the option to "select from map" was checked and next we added an expression set. The expression we wanted to create was to select the earthquakes with magnitudes with a value of at least 4. Next we created a second query to select data with a location that contains Alaska and another which selected earthquakes with occurred in the year 2000. 


(Fig. 3) This is the window used to configure the query widget.
(Fig. 4) This image shows the output data from the query widget.
Part 2: Customizing WebApp Builder for ArcGIS (Developer Edition)

In part 2 of this lab exercise we learned how to use the developer edition of the Web AppBuilder which can be used to create a more customized web map. The developer edition is able to be run locally on the computer. To do this we first ran the developer start up file, specified the URL and began creating the web app. After registering the app we imported the app created in part 1. We were then able to edit and customize the app. In customizing the web app we added the batch attribute widget by selecting local file and it will then become a functioning attribute in the web app. 
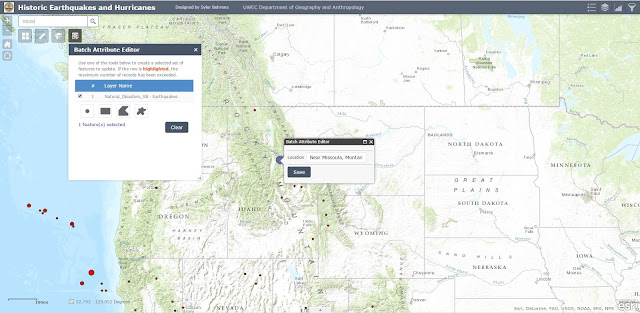
(Fig. 5) The batch attribute editor utilized within the web app builder.
Results

Throughout this lab we learned how to create web applications using ArcGIS Online as well as how to integrate and customize widgets within these web maps. 

The map can be viewed at the following link: Historic Earthquake and Hurricanes

(Fig. 6) The final map can be seen above.
Sources

The data used in this lab was from the following sources and provided by Dr. Cyril Wilson of the University of Wisconsin - Eau Claire:

  • Fu, Pinde (2015)
  • \\EsriPress\GTKWebGIS\Chapter3\Data.gdb\Earthquakes, courtesy of USGS National Atlas
  • \\EsriPress\GTKWebGIS\Chapter3\Data.gdb\Hurricanes, courtesy of NOAA National Climatic Data Center

Wednesday, September 23, 2015

Lab 2: Geospatial Web Services

Goals

In this lab we were able to learn the skills to both author and create geospatial web services. Throughout this lab exercise we were introduced to the process of authoring geospatial data to create as well as host geospatial web services on ArcGIS Online for Organizations and also through the ArcGIS server and the server hosted by UWEC's department of Geography and Anthropology. During this lab we learned the techniques of how to publish geospatial web services to various formats such as ArcMap, through the ArcGIS server, shapefiles and Excel CSV files. We were introduced to the creation of a feature access service which allows for end-user editing.

Methods

Part 1: Publishing Feature Hosted Services through ArcGIS Online

In this first portion of the lab we needed zip a large feature dataset in order to upload the data directly to the ESRI cloud. To do this we first zipped the data and after logging in to ArcGIS Online added the file to our individual contents and publish the file as a feature service. Once the zip file was uploaded to ArcGIS Online and the file was published as a feature service it could then be added to a map. The layers within this zip file then became editable features within the web-based map. 


(Fig. 1) This is the window which appears after the data from the zip file we created was published on ArcGIS. As can be seen in this image the data is now in the form of a feature service.
Another dataset which can be added to ArcGIS Online is a feature hosted service using a CSV file. While the process of publishing an Microsoft Excel CSV file is the same as adding a group of shapefiles in the form of a zip file as explained earlier it was a new way in which we learned how data could be incorporated into the ArcGIS Online interface. The CSV file used in this portion of the lab was based on Wisconsin Fire Occurrence data. Once it was published to ArcGIS Online we needed to assign the X and Y data from within the CSV file to longitude and latitude respectively in order to locate the features. We were also able to configure pop-ups. Pop-ups allow web maps to be much more interactive and help to display relative data when an end user selects a feature. For instance, in this case when the viewer of the map of Wisconsin Fire Occurrences selects a point which represents a fire they are able to see information about the date of the fire (Fig. 2).


(Fig. 2) By utilizing pop-ups through ArcGIS Online's mapping service we can give more detail about individual data points in a given feature class. As seen in this image for instance we can enable pop-ups so the end user is able to select each data point and gain more information about that particular point.
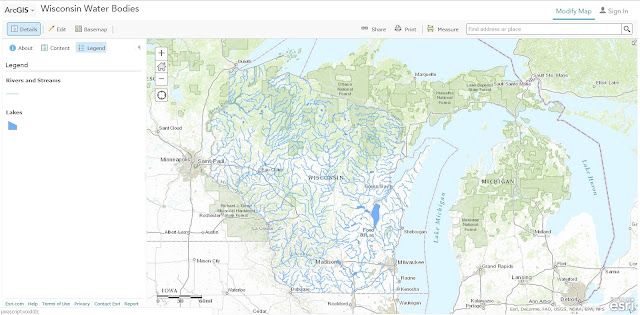
Yet another way which we learned how to publish feature services was directly through ArcMap. By using this method, every dataset within the map document is published in a single instance. To do this we first loaded two data sets, lakes as well as rivers and streams, and selected to share as a service. The next step was to edit the feature service in order to control what types of edits the users can make. Feature services can be configured so that end users can create or add, delete query and update features or data within the feature service. Next, we had the option to share the service and within the service editor we clicked the "analyze" option in order for the program to examine the map you are about to publish and make sure there are no errors. As long as no errors are found (or the errors are fixed) the service can be published and viewed on ArcGIS Online. 

Part 2: Publishing a Tiled Map Service Using ArcGIS Online

Similarly to part 1, the second part of this lab exercised focused on publishing feature services and other data types to ArcGIS Online, however in this portion we published these services using the ArcGIS Server. The first step in this process was to add a database connection using ArcCatalog. To do this we selected the SQL Server as our database platform and authenticated the database using our individual username and password. Next we added a raster data file to the new database we connected to. After cleaning up the dataset by changing the symbology a bit, we were ready to share the data as a service (similar to how we did in part 1 of the lab). However, one big difference in the procedure was connecting to the UWEC Geography and Anthropology Department ArcGIS Server in this portion. To do this we needed to add an ArcGIS Server by again entering in information such as the server URL and more authentication information (Fig. 3). 


(Fig. 3) In order to share a service to ArcGIS Online using the ArcGIS Server we needed to connect to the server itself before our feature service was able to be published.
Once this was complete we then got the list of options available to us through the service editor window which, as discussed in part 1, allowed us to set the different parameters for our image. One particular option we looked at in part 2 of this lab exercise was caching. We adjusted the caching for this service so that when users go to access this feature service it will be draw using tiles from a cache. This option minimizes the stress put on the server. We also set the minimum caching scale to 10 and the maximum to 17 and changed the tile format to mixed rather than PNG. As we did in part 1 we again selected the "analyze" option within the service editor to check for errors and when none were found (or they were all resolved) we were able to publish the service. 

(Fig. 4) Within the Service Editor in ArcMap the developer has the option to adjust a wide variety of settings which will impact the end user's experience when viewing the final published service. In this image the cache settings are being adjusted.

Part 3: Author a Map Document, Create a Feature Service & Add to a Web Map

In the final part of the lab we authored a map, created a feature service and a reference for the service in a web map. The first step in this process was to import two sets of data: earthquakes and hurricanes. Next, we changed the symbology of both layers in order to make it easier for the viewer to understand which events were more severe than others by using a graduated color ramp for hurricanes and graduated symbols for earthquakes. Then we enabled time as a layer for both of the two sets of data. To do this we selected the "time" tab within the layer properties and used the dates of the events in the time field. Once this was applied in ArcMap we were able to enable the time on the map and view the progression of the events based on the dates each natural disaster occurred. When we later went to share the service and publish the features to ArcGIS Online we needed to enable this content in the "capabilities" portion of the service editor so that the end-users would be able to see this time progression in the final product as well. 


(Fig. 5) Within the layer properties of both the earthquake and hurricane layers we were able to enable time. This then displays the individual events over time rather than just a set of stagnant points.
(Fig. 6) Once both layers have time enabled we are able to use the time slider tool in ArcMap to display the events and make sure everything is working correctly.
To produce the final map we enabled pop-ups for both the earthquake data points and the hurricane lines to include information about each of the events including date they occurred, name and other pertinent data. In addition we were also able to apply the time settings in order to display the progression of events.

Results

As a result of this lab exercise we learned how to publish and share feature services from a wide variety of platforms including CSV files, zipped files, as well as directly using ArcMap and ArcGIS Server. The maps which I published can be seen using the links below. 

Part 1 Maps:


Part 3 Map: 


Sources

Data sources for this lab are listed below in the order they were used: 
  • Mastering ArcGIS Geodatabase by Maribeth Price, 2014
  • Wisconsin DNR, 2013
  • Cyril Wilson, 2012 (unpublished Lakes dataset)
  • Advanced Remote Sensing Class at UW-Eau Claire, Fall 2012
  • Fu, Pinde, 2015
  • \\EsriPress\GTKWebGIS\Chapter3\Data.gdb\Earthquakes, courtesy of USGS National Atlas
  • \\EsriPress\GTKWebGIS\Chapter3\Data.gdb\Hurricanes, courtesy of NOAA National Climatic Data Center


Monday, September 14, 2015

Lab 1: Cloud GIS Basics

Goals

Throughout this lab exercise we were first introduced to web maps and their basic functionalities from the perspective of an end user. We also went through the process of creating our own web maps from a developer's perspective and a story map. In this exercise we used ArcGIS Online which works along with UWEC's Geography and Anthropology Department.

Methods


Part 1: Exploring and Customizing Web Maps 

In the first part of this lab exercise we were introduced to ArcGIS online, web maps and their basic functionality. We explored a map of Hawaiian Island Volcanism and were able to understand just how interactive web maps are and the many advantages they have compared to traditional maps. Using web maps it enables the end user to not only see the geographic location of features but also learn information about certain features within the map. As shown in Fig. 1 for example, by clicking on the various volcanoes the viewer is given a description of the volcanoes, the elevation, the last eruption and an image. 

(Fig. 1) This map of Hawaiian volcanism is an interactive web map found on ArcGIS Online created by Chris Harder.

Part 2: Creating a New Map

We also learned that you don't need to "reinvent the wheel" when it comes to creating web maps but rather preexisting maps can be saved and edited. Also, using ArcGIS Online you can create web maps from scratch by selecting a base map and loading in data layers which other users have created and shared (Fig. 2). In this particular case we re-created the map we viewed in Part 1 by adding in data layers and adjusting them in a way to personalize them.


(Fig. 2) Adding data layers to a new map.
Part 3: Building a Story Map

Creating a web map was a very interesting process and it was amazing how simple they are to make. By saving a map based on the area of interest we had the option to create a web application. There are a number of different templates but in this particular case we created a Story Map Tour. We added images to the map by uploading the files, adding information such as a title and description and then adding the location based on the address, latitude and longitude of where the image was taken. After uploading all our photos the story map was complete. The end result of my map can be found in the following link: http://arcg.is/1QcOLwm

Results

Throughout this lab we were introduced to web mapping and creation of story maps via ArcGIS Online. Not only were we able to understand how to use web maps from an end user perspective but also how to create them from a developer perspective. A product of this lab was also the story maps we created to chronical a previous Geography 368 Field Trip to Texas.

Sources

The data for this lab was gathered via ArcGIS Online and directly Chris Harder. Data which was used to produce the story map was from Dr. Cyril Wilson of UW-Eau Claire.